
Home › Insights › Market Insights › Q2 2026
Quarterly Insights · Q2 2026
Space. The Final Frontier.
The first half of 2026 produced record-setting markets, extraordinary AI-related investment and a meaningful broadening of leadership. The excitement is real, but momentum and elevated valuations make portfolio discipline especially important.
Mark Whidby, CFA | Chief Investment Officer | Published July 22, 2026 | Market Insights
The first half of 2026 was a rocket launch in more ways than one. Major U.S. indexes delivered their strongest quarter in years, the Russell 2000 reached a record close, and spending on artificial-intelligence infrastructure drove remarkable gains in semiconductor and related companies.
The market’s enthusiasm rests on genuine investment and earnings growth. At the same time, the speed and concentration of the gains invite an old behavioral risk: fear of missing out. The appropriate response is not to ignore innovation. It is to participate through a portfolio that remains prepared for more than one possible outcome.
+25.7%
Emerging-market ETF total return through June 30, 2026
~$750B
Magnificent Seven estimated 2026 AI capital-spending pace
+24%
FactSet estimate for 2026 S&P 500 earnings growth
The S&P 500 returned 10.2% during the first half of 2026, including a 15.3% second-quarter gain. That was its best quarter since the 2020 COVID rebound. The Nasdaq and Dow also posted their strongest quarter in five years, while the Russell 2000 completed its best first half since 1991.
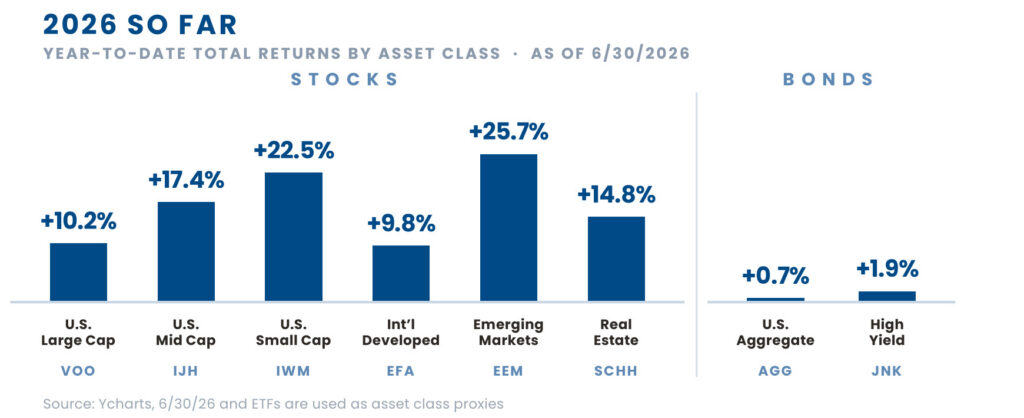
Returns were not limited to U.S. large companies. U.S. mid-cap stocks gained 17.4%, U.S. small-cap stocks gained 22.5%, emerging markets rose 25.7%, and U.S. real estate returned 14.8%. International developed stocks gained 9.8%. Bonds were more subdued, with U.S. aggregate bonds returning 0.7% and high-yield bonds returning 1.9%.
The Magnificent Seven were on pace to spend approximately three-quarters of a trillion dollars on AI infrastructure during 2026. That investment flowed to semiconductor and infrastructure companies. The iShares Semiconductor ETF (SOXX) gained 113% during the first half, while semiconductor companies added approximately $2 trillion in market capitalization.
Earnings expectations rose alongside that investment. FactSet’s estimate for 2026 S&P 500 earnings growth increased to approximately 24%, compared with roughly 12% at the start of the year. Earnings growth above 20% for the largest companies is unusual outside the rebound following a recession, but it can occur during a secular bull market supported by expanding profits.
The companies paying for AI infrastructure did not automatically share in the same market enthusiasm. The Roundhill Magnificent Seven ETF (MAGS) was down 2.5% for the year through June 30. Microsoft declined 22.6% during the first half, including a 17% decline in June.
Value stocks held up better in several areas, supported by energy and manufacturing. The iShares S&P 500 Value ETF (IVE) gained 7.9%, compared with 11.7% for its growth counterpart (IVW). The contrast illustrates how quickly leadership can change when momentum is strong.
Small and mid-sized companies made a meaningful comeback. The iShares Russell 2000 ETF (IWM) gained 21.4% during the second quarter and 22.5% for the first half. The iShares Core S&P Mid-Cap ETF (IJH) gained 17.4% year to date. Both outpaced U.S. large-cap stocks.
International markets also participated. The iShares MSCI EAFE ETF (EFA) gained 9.8%, while the iShares MSCI Emerging Markets ETF (EEM), which includes substantial semiconductor exposure, gained 25.7%. Broader participation is constructive because it reduces the degree to which portfolio results depend on a small group of U.S. companies.
AI may ultimately be deflationary, but the bond market remained cautious. The 30-year Treasury yield reached 5.18% during the quarter, its highest level since 2007, before ending the first half near 4.9%. May CPI inflation reached 4.2%, a three-year high, while volatile oil prices and rising infrastructure costs continued to affect the inflation outlook.
Higher chip costs and the broader AI infrastructure race were also working through the economy. The key question is whether the resulting inflation proves temporary or structural. The U.S. Aggregate Bond ETF (AGG) returned only 0.7% during the first half.
Real estate had been overlooked for several years, but its 2026 results were difficult to ignore. The Schwab U.S. REIT ETF (SCHH) gained 14.8% through June 30 and was on pace for its best year since 2021.
The performance is another reminder that an asset class can begin contributing before investor sentiment fully improves. Diversification provides exposure to those recoveries without requiring investors to identify the exact turning point in advance.
Strong returns in AI infrastructure, semiconductor companies and private-space businesses naturally attract attention. The SpaceX initial public offering raised approximately $85.7 billion, the largest IPO on record, and its market capitalization reached approximately $2.01 trillion.
Today’s market is supported by real earnings growth, but parts of it are beginning to resemble the late 1990s. High valuations can encourage money grabs, mega-IPOs and mergers. Momentum is powerful. So is gravity.
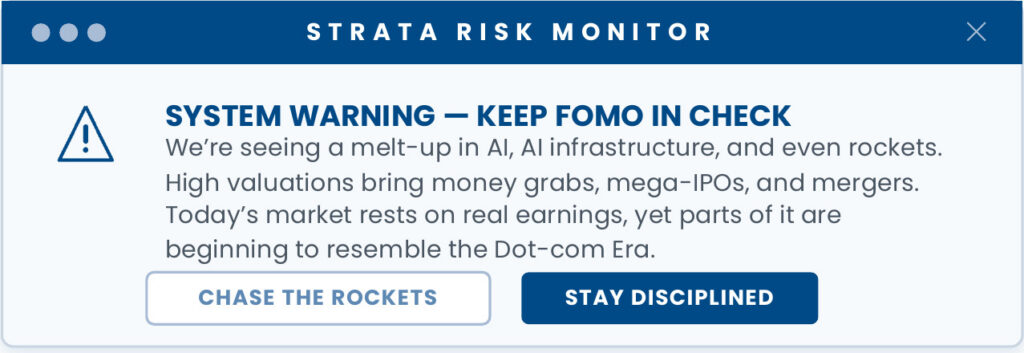
Diversification remains the portfolio's first line of defense against the temptation to chase whatever is flying highest.
That does not mean avoiding innovation or assuming that strong markets must immediately reverse. Artificial intelligence, reusable rockets, autonomous systems and other advances are rapidly moving from science fiction toward everyday reality. The opportunity may be substantial.
The challenge is that no investor knows in advance which companies will capture the economic value, how long current leadership will persist, or when market expectations may move ahead of fundamentals. A diversified portfolio allows investors to participate while remaining prepared for the opportunities that may emerge if markets eventually return to Earth.
Read the complete Q3 report
Download the approved five-page report, including the original market commentary, asset-class results and complete disclosures.
Mark Whidby, CFA, is Chief Investment Officer of Strata Wealth Advisors. He leads the firm’s investment research, portfolio strategy and investment-management process.
DISCLAIMER
This material is provided for informational and educational purposes only and should not be construed as personalized investment, legal, tax, or accounting advice. The information herein is not intended to be, and should not be relied upon as, a recommendation to buy, sell, or hold any security, strategy, or investment product. Investment advisory services offered through Strata Wealth Advisors, LLC, an SEC registered investment adviser. Registration with the SEC does not imply a certain level of skill or training. The views and opinions expressed are those of Strata Wealth Advisors, LLC as of the date of publication and are subject to change without notice. Certain information contained herein has been obtained from third party sources believed to be reliable, but Strata Wealth Advisors, LLC makes no representation or warranty as to the accuracy, completeness, or timeliness of such information. Strata Wealth Advisors, LLC has no obligation to update this material or to advise of any changes in the information contained herein. Past performance is not indicative of future results. All investments involve risk, including the possible loss of principal. There can be no assurance that any investment strategy, allocation, or approach will achieve its objectives, generate profits, or avoid losses. Diversification and asset allocation do not guarantee a profit or protect against loss in declining markets. This report may include discussion of market indexes, asset classes, exchange traded funds, mutual funds, or other securities. Indexes are unmanaged and cannot be invested in directly. Index returns do not reflect the deduction of advisory fees, transaction costs, taxes, or other expenses that would reduce actual investor returns. Where exchange traded funds are used as proxies for asset classes, indexes, or market segments, they are included for illustrative and analytical purposes only. ETF proxy returns may differ from the returns of the underlying asset class, index, or market segment due to fees, expenses, tracking error, methodology, liquidity, holdings, market pricing, and other factors. The use of any ETF as a proxy does not constitute a recommendation to buy or sell that ETF. Any reference to a specific security, ETF, mutual fund, index, manager, or investment product is for illustrative purposes only and should not be interpreted as a recommendation or endorsement. Actual client portfolios may differ based on investment objectives, risk tolerance, tax considerations, account restrictions, timing, cash flows, and other individual circumstances. Any forward looking statements, forecasts, estimates, or market outlooks are based on assumptions and current market conditions, which may change. Actual results may differ materially from expectations. Economic and market forecasts are inherently uncertain and should not be relied upon as an indication of future results. This material does not take into account the specific objectives, financial situation, or particular needs of any individual investor. Before making any investment decision, investors should consult with their financial, tax, and legal advisors regarding their specific circumstances. Fidelity Investments is an independent company, unaffiliated with Strata Wealth Advisors, LLC. Fidelity Investments is a service provider to Strata Wealth Advisors, LLC. There is no form of legal partnership, agency affiliation, or similar relationship between your financial advisor and Fidelity Investments, nor is such a relationship created or implied by the information herein. Fidelity Investments has not been involved with the preparation of the content supplied by Strata Wealth Advisors, LLC and does not guarantee, or assume any responsibility for, its content. Fidelity Investments is a registered service mark of FMR LLC. Fidelity Clearing & Custody Solutions provides clearing, custody, and other brokerage services through National Financial Services LLC or Fidelity Brokerage Services LLC, Members NYSE, SIPC. 799673.1.0